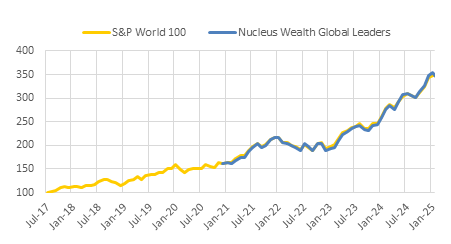
| Period | Return |
|---|---|
| 1m | 4.2% |
| 3m | 10.1% |
| 1y | 11.9% |
| 3y | 21.9% p.a. |
| Incept. | 18% p.a. |
Return to 30 Jun 2025
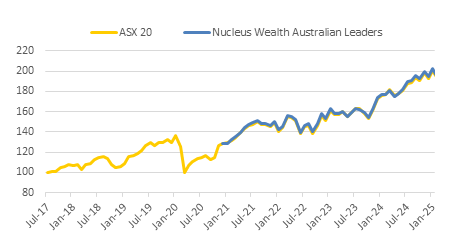
| Period | Return |
|---|---|
| 1m | 1.8% |
| 3m | 9.6% |
| 1y | 12.4% |
| 3y | 13.5% p.a. |
| Incept. | 10.9% p.a. |
Return to 30 Jun 2025
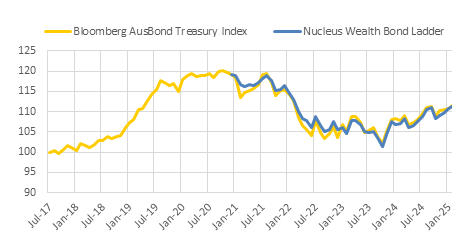
| Period | Return |
|---|---|
| 1m | 1.3% |
| 3m | 2.6% |
| 1y | 6.4% |
| 3y | 2.6% p.a. |
| Incept. | -0.9% p.a. |
Return to 30 Jun 2025

.webp?width=100&height=100&name=Direct-Indexing-29AAC8%20(1).webp)